Occupancy
Docksters has integrated support for facilities management. With Docksters you can quickly identify which zones, rooms and areas are occupied and which ones are empty. Docksters also gives you long term analysis to give you answers to questions like “Which days of the week are the busiest in the building?” and “Which of our meeting rooms are currently under used?”. With our Occupancy module you can easily view the current status of your rooms and the most/least used rooms by occupancy percentage.
This module is disabled by default. You can contact your Docksters Partner to have it enabled for you.
Occupancy Module
First off, make sure the Occupancy module is enabled for your Docksters environment. You can recognize all Docksters modules by the plug icon on the right side of the menu item.

Ready to go
Our Occupancy module requires no setup at all. All you need to do, is make sure that you use the "Occupancy" data type when defining your data points in a Device Definition.
As stated above, you need to use the "Occupancy" data type to display data in this module. Please note that this is not the same thing as the "Motion" data type.
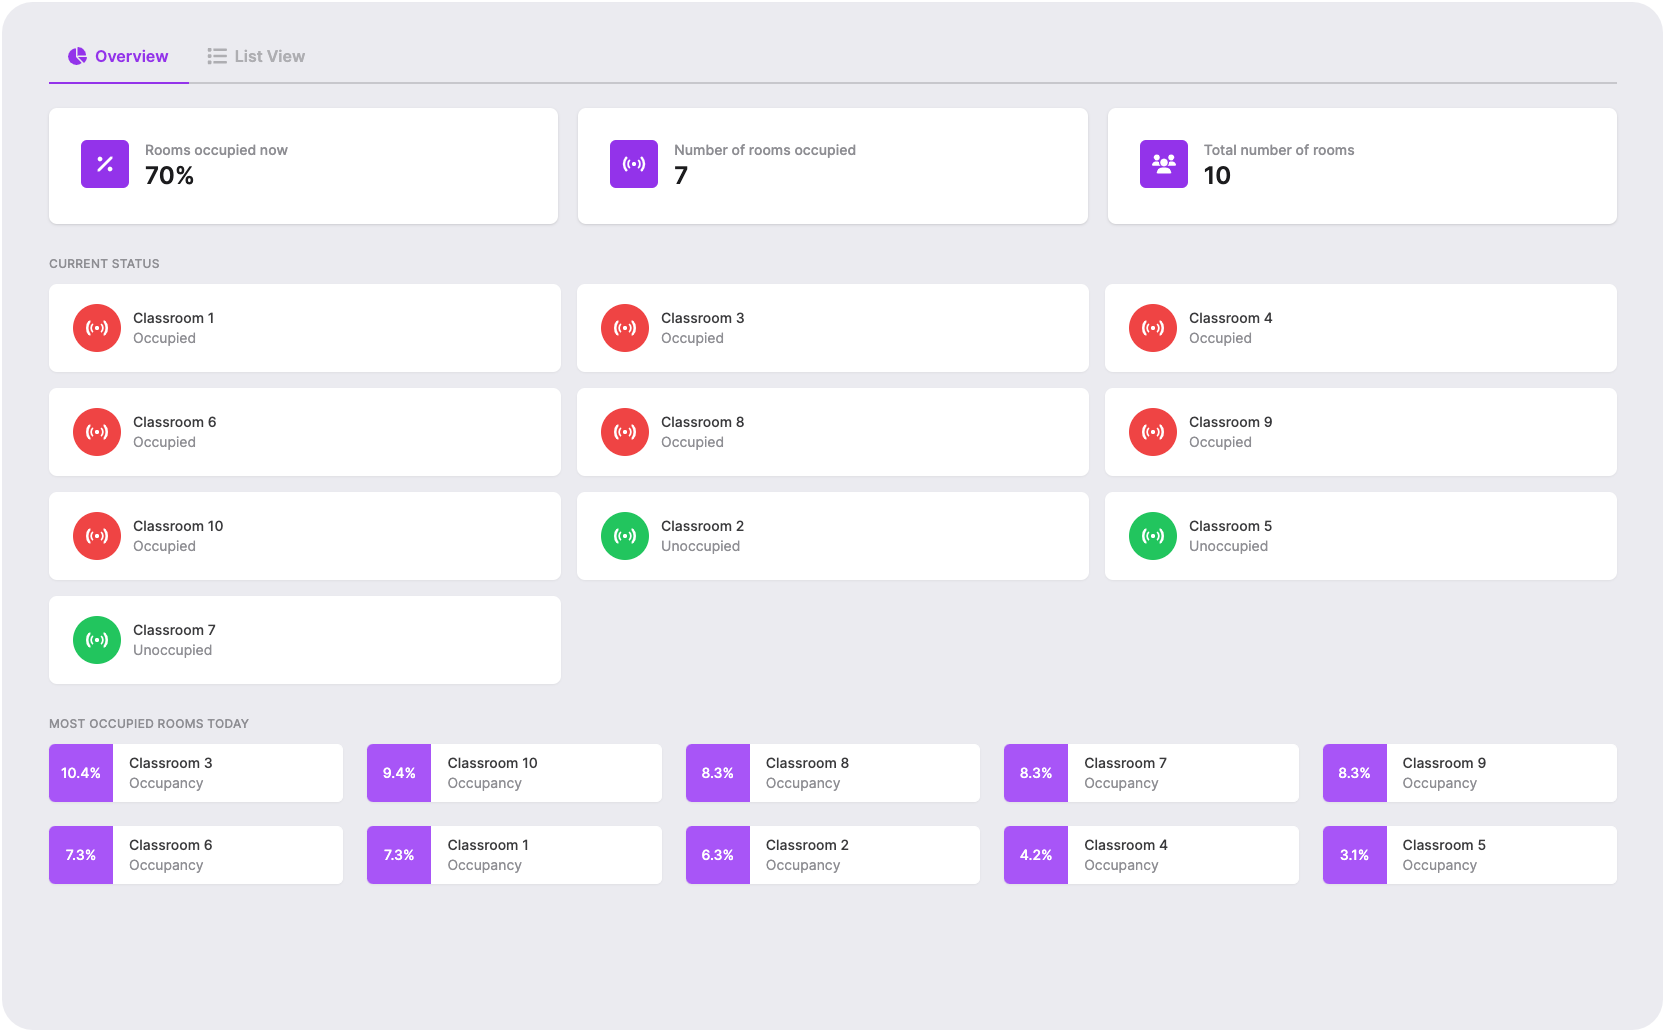
Overview
When you click on the Occupancy module, the first thing you see is an overview of all your devices with an occupancy data point. On top you can see three badges, showing the percentage of rooms occupied right now, the number of rooms occupied right now and the total number of rooms in your Docksters environment.
Under the three badges, you will find a grid with all your rooms. The rooms are filtered based on occupancy status and show different colors for the two occupancy states (occupied/unoccupied).
Lastly, we show the most and least occupied rooms today. Based on the total time it was occupied during the day, we show the top 10 and bottom 10 devices in your Docksters environment.
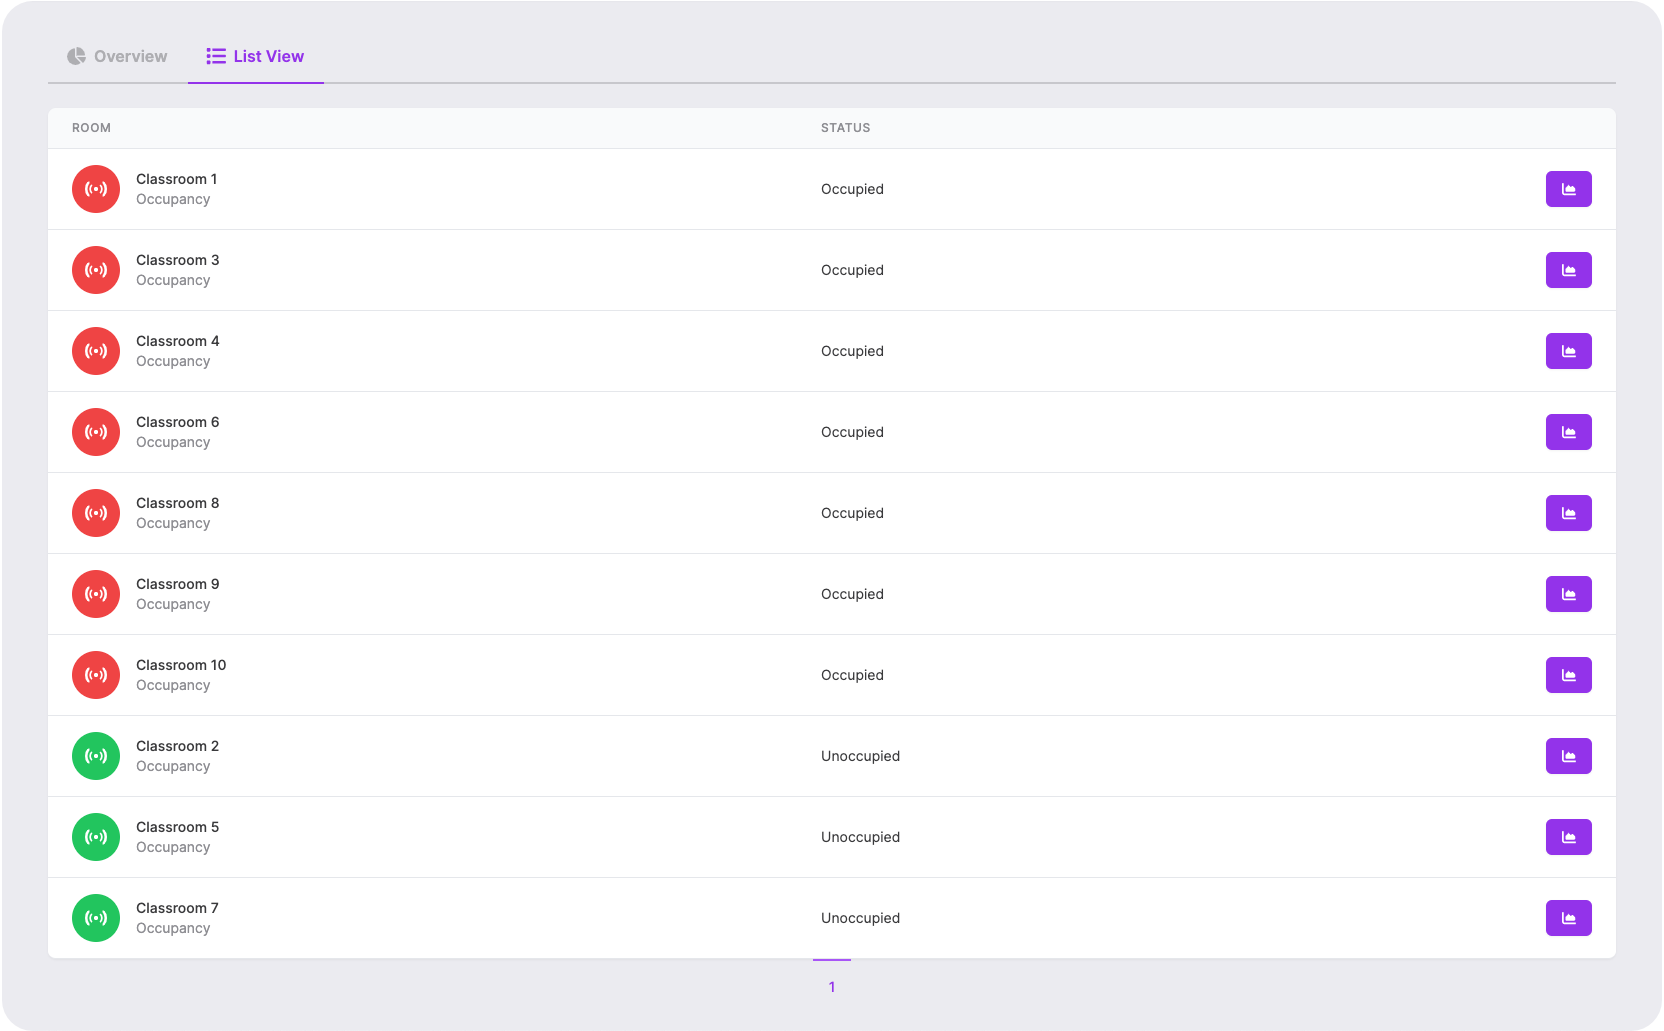
List view
When you switch back to the List View tab you can find a list containing the same information as in the grid view. Each row in the list has an added graph button, that will send you to that specific device's data point details page when clicked. If you have any questions about the Occupancy module or this tutorial, please contact us.