Structures
Smart buildings are a major segment of the IoT space. With modern IoT technology, building owners and operators are able to collect detailed data about their properties, giving them unprecedented insight into metrics like temperature, humidity, CO2, and lighting levels. In this tutorial we will quickly guide you through the steps of creating a new structure and visualizing your own data.
This module is disabled by default. You can contact your Docksters Partner to have it enabled for you.
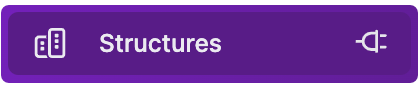
Structures Module
First off, make sure the Structures module is enabled for your Docksters environment. You can recognize all Docksters modules by the plug icon on the right side of the menu item.
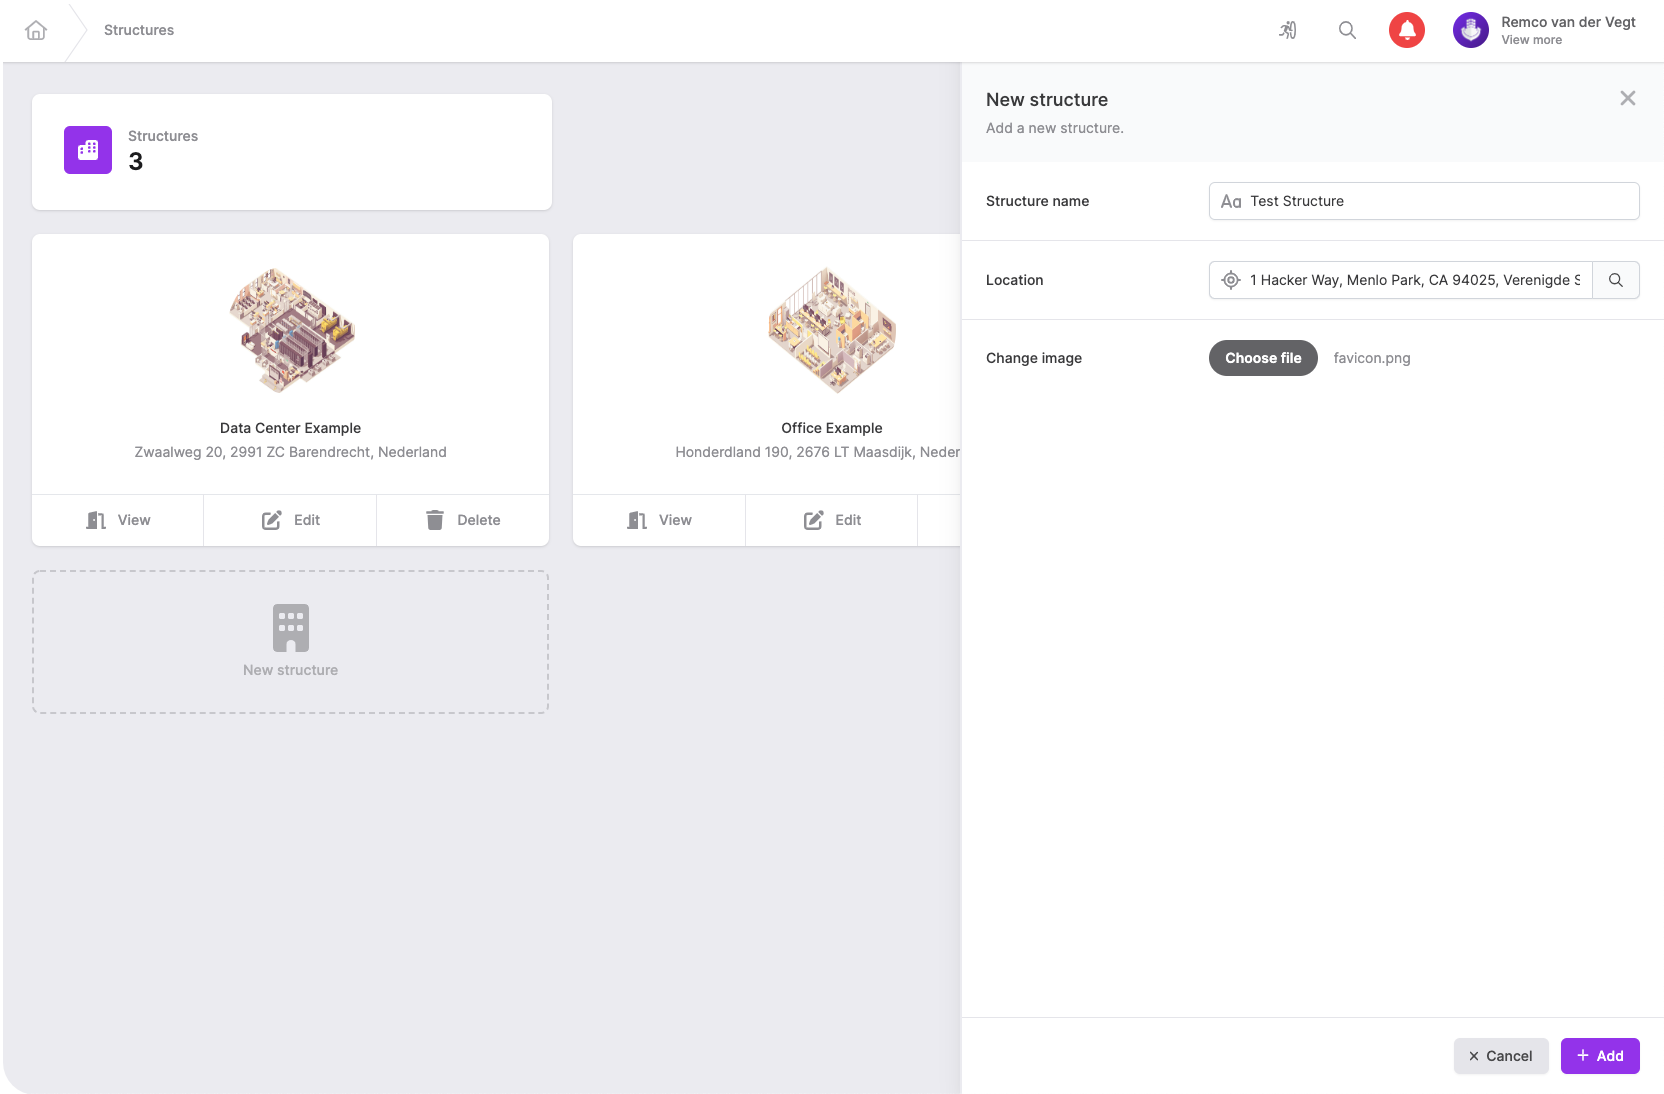
Add a new Structure
Next up is creating a new Structure. When you click on the New structure button, a slideover will appear. In this slideover you can enter information about your Structure, like a name, a location and a small preview picture of the building.
Add a new layer
When you click on your new Structure, you will find an empty screen asking you to add a new layer to your Structure. A layer can be seen as a floor in your building. If you have multiple floors, you can add multiple layers, each with their own floorplan.
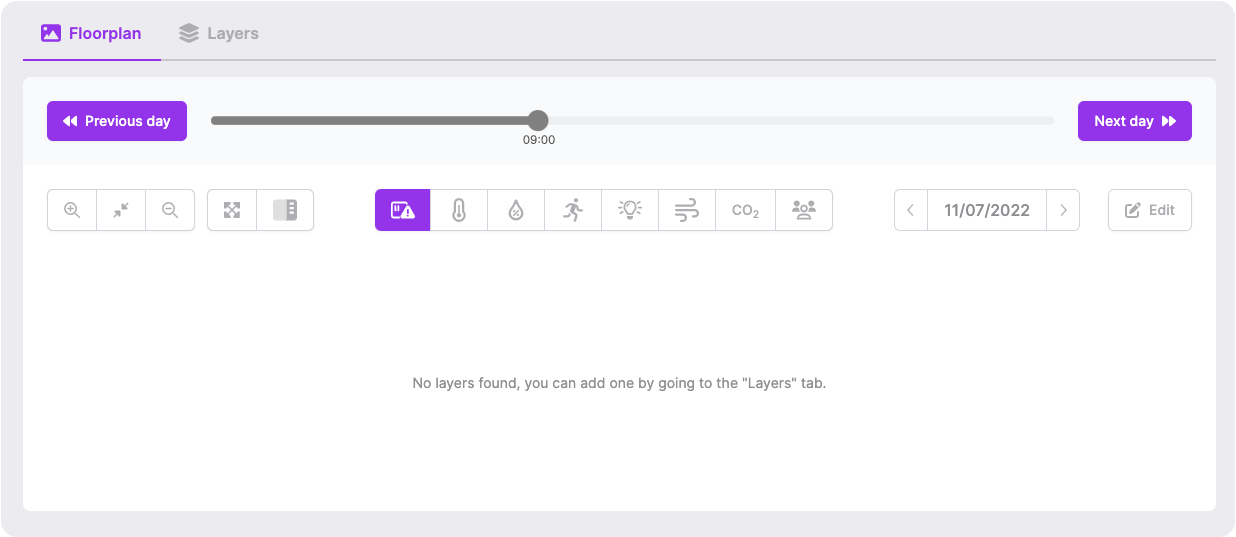
Click on the Layers tab (top left) to add a new layer. Give your layer a name, upload an image of your floorplan and you're done!
Add zones
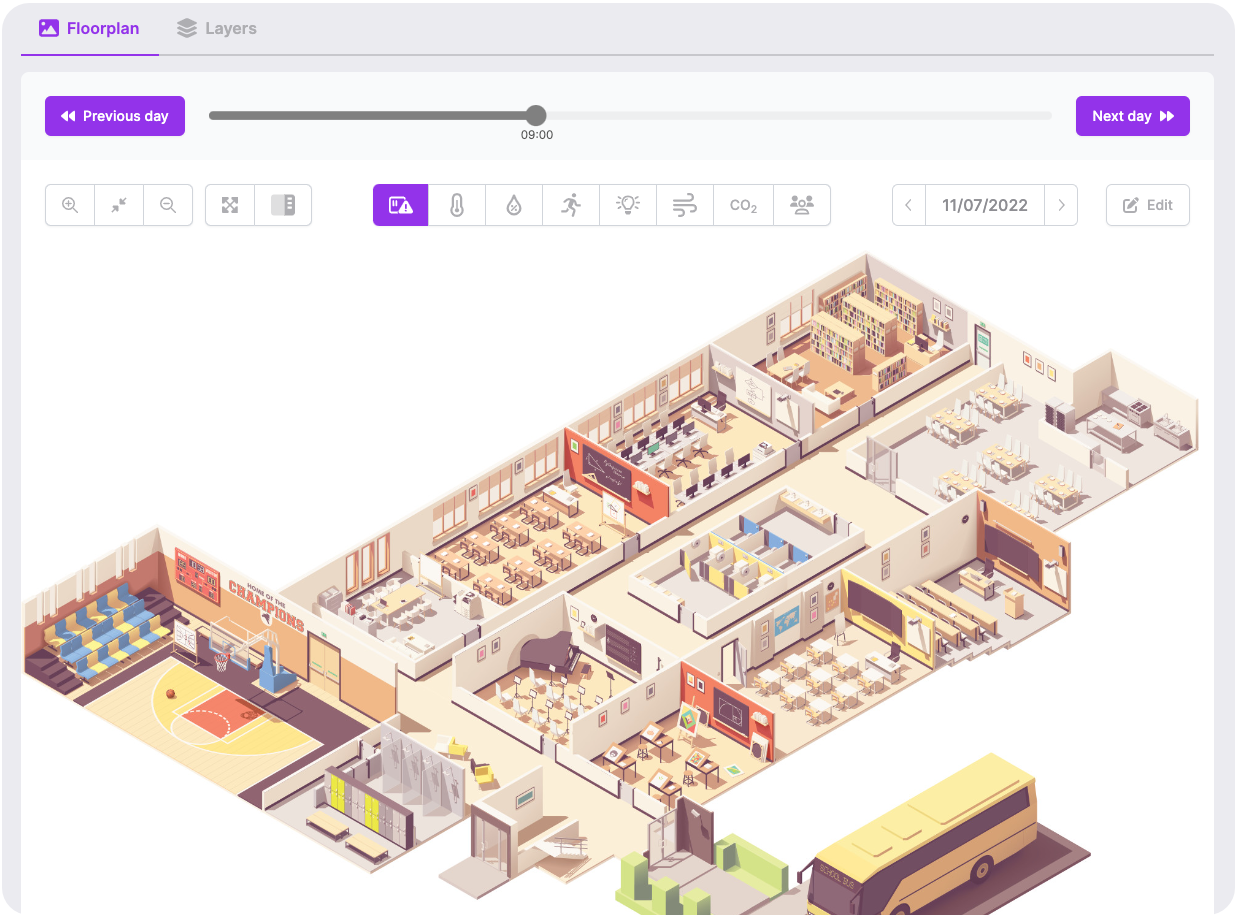
When you switch back to the Floorplan tab you will be met with the image you just uploaded. To visualise device data in this floorplan, we need to define the zones where your devices are hanging.
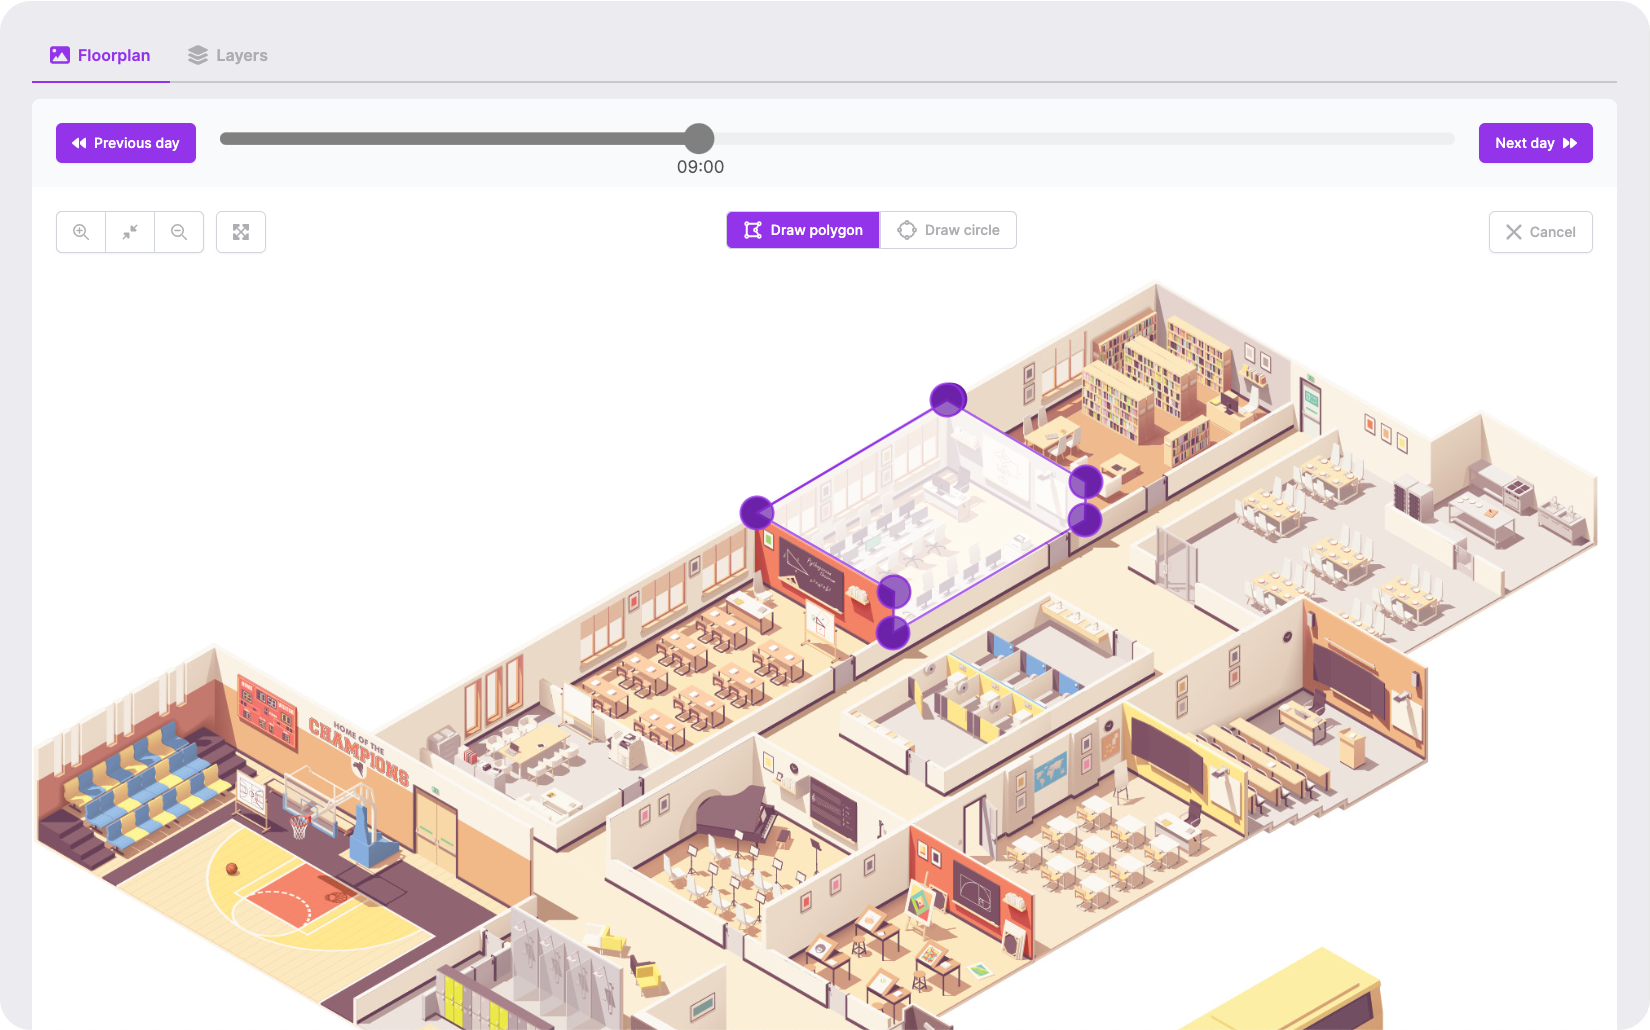
Draw a new zone
To start drawing a new zone, press the Edit button and click the Add zone button to start drawing. By simply clicking on the corners of your zone, you can draw a polygon area or a circle. To finish your zone, make sure your first and last point link together.
Enter zone details
To finish your zone, you need to enter a few details. Give your zone a name to easily recognize it, and add the correct Docksters device to this zone.
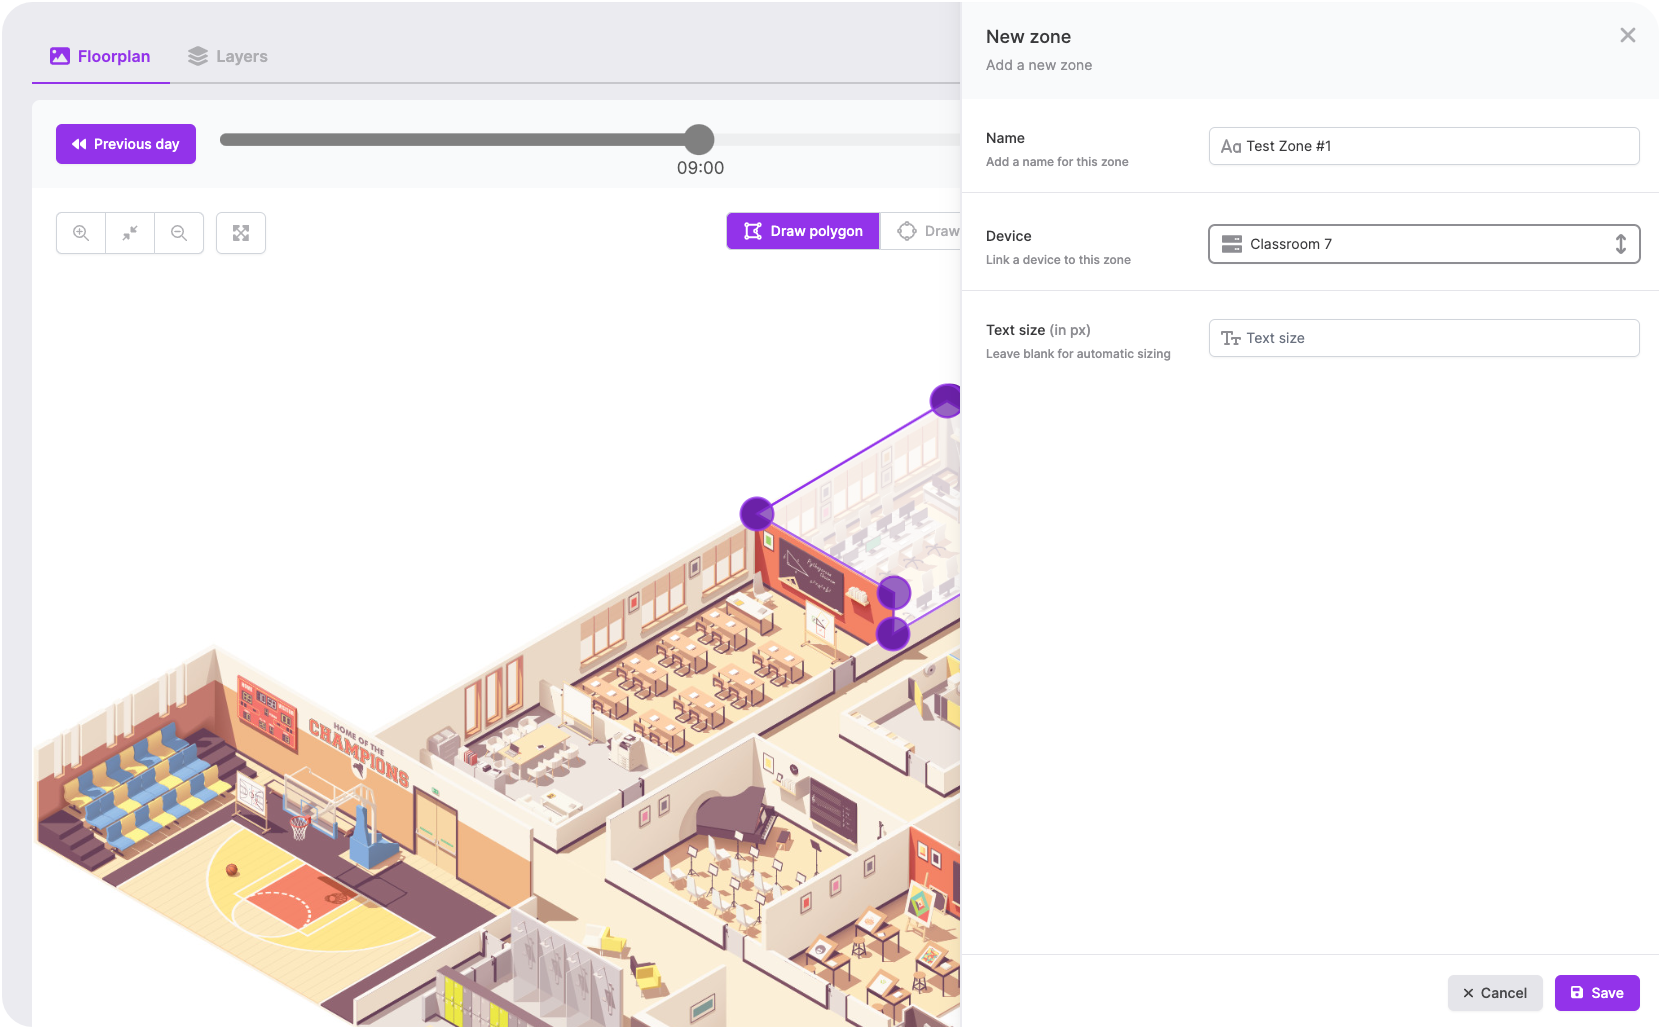
Optionally, you can set a text size in pixels. If you leave this blank, Docksters will automatically calculate a text size for your zone.
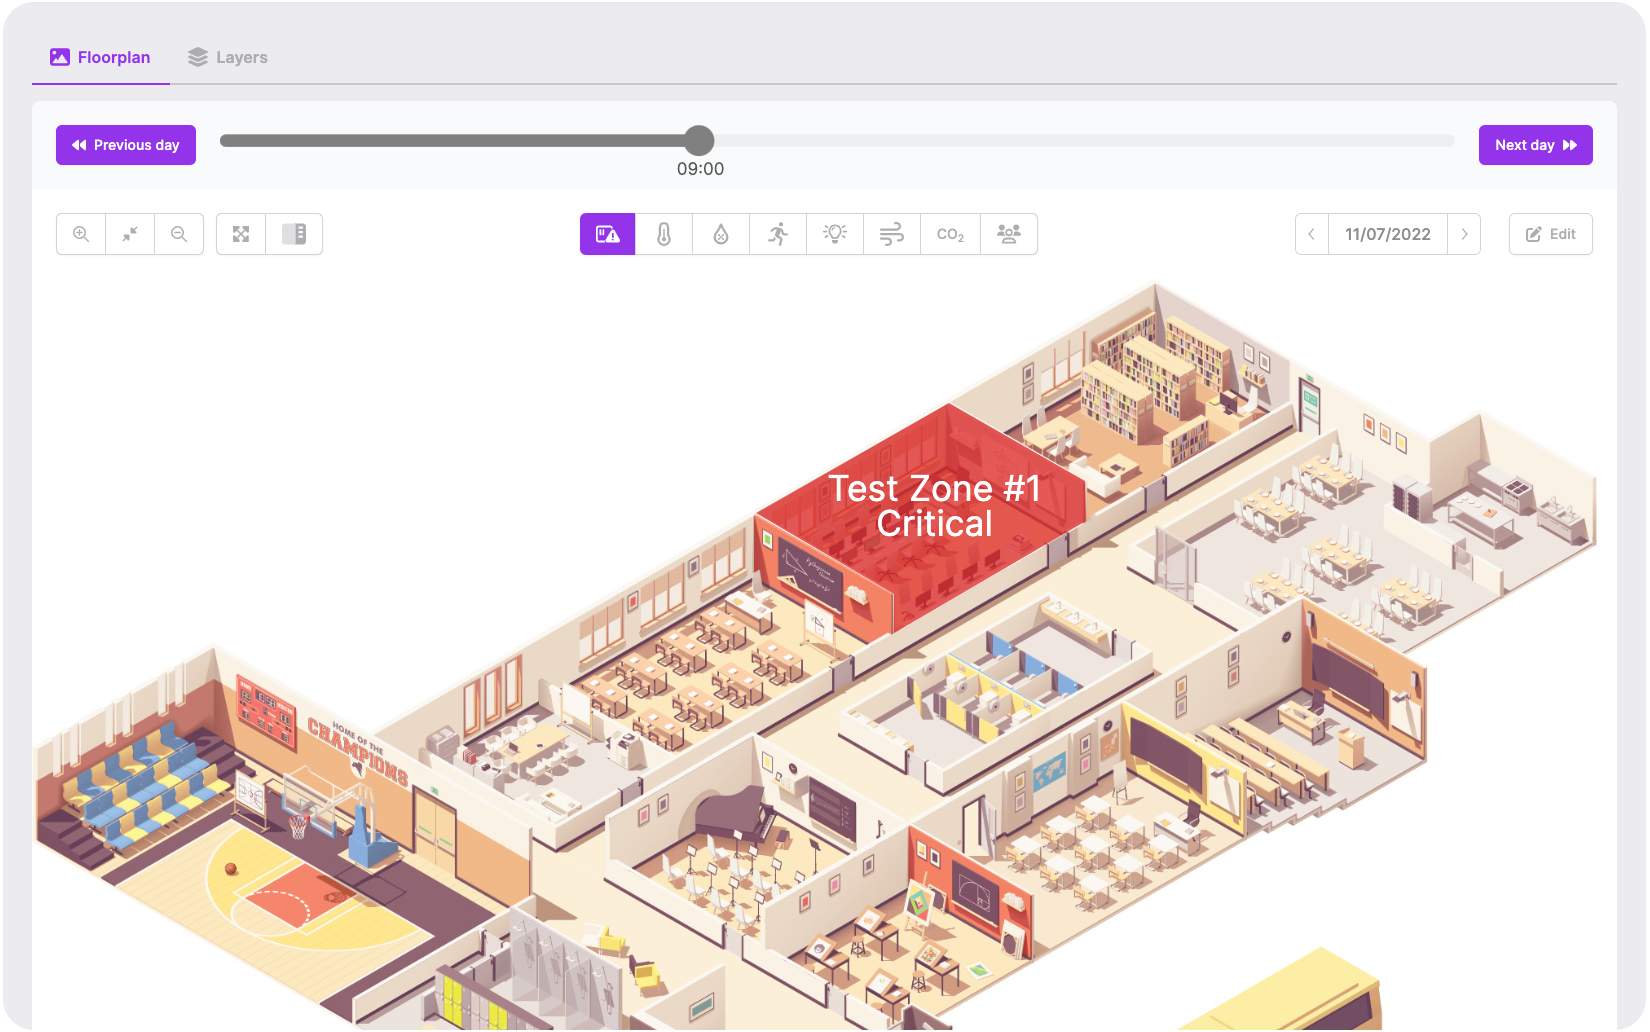
View your data
After pressing the Save button, you're done! You can now view your zone's data throughout the day by using the buttons and slider on top. If you have any questions about the Structures module or this tutorial, please contact us.