Reports
Reports allow you to track the performance of your IoT devices and systems, identifying any issues or areas for improvement. This can help you optimize your processes and reduce downtime, leading to increased productivity and revenue. In addition, reports provide a comprehensive overview of your IoT data, allowing you to easily share insights with team members and stakeholders. This can facilitate better collaboration and decision-making, helping your organization stay ahead of the competition.
This module is disabled by default. You can contact your Docksters Partner to have it enabled for you.
Reports module
First off, make sure the Reports module is enabled for your Docksters environment. You can recognize all Docksters modules by the plug icon on the right side of the menu item.
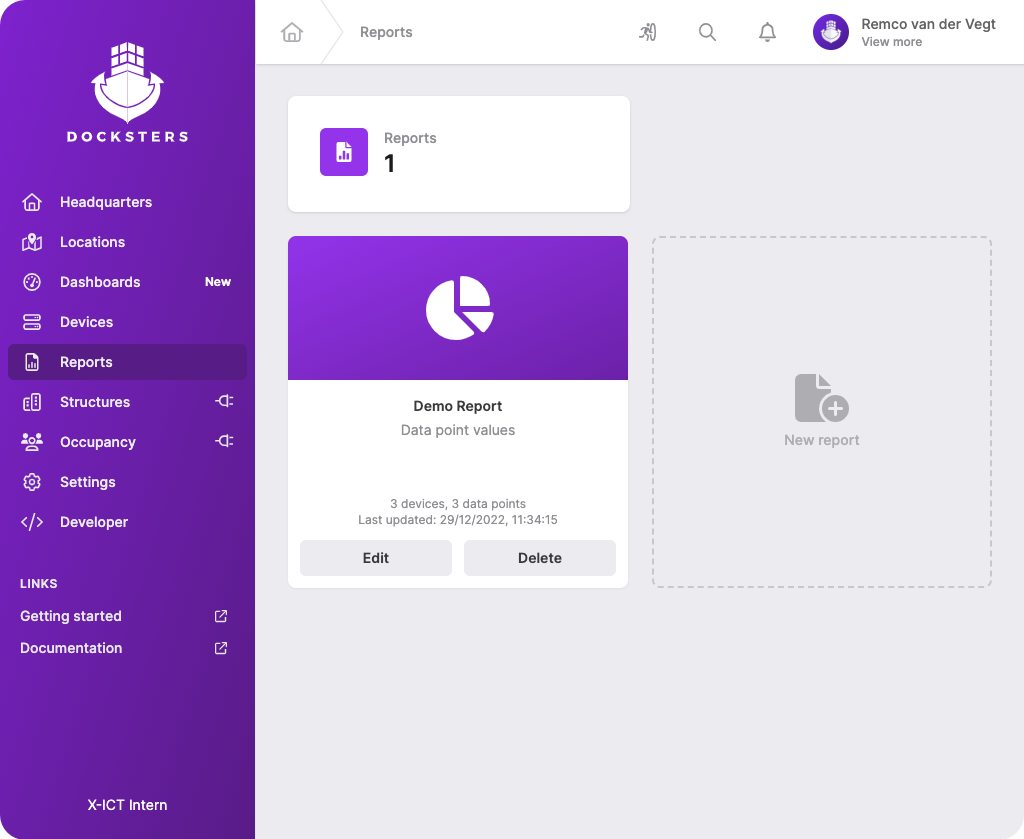
Add a new report
To get started with our Reports module, you click on the menu item in the sidebar. After doing that, you will find a list of all your reports. In this example, we have one report, called "Demo Report".
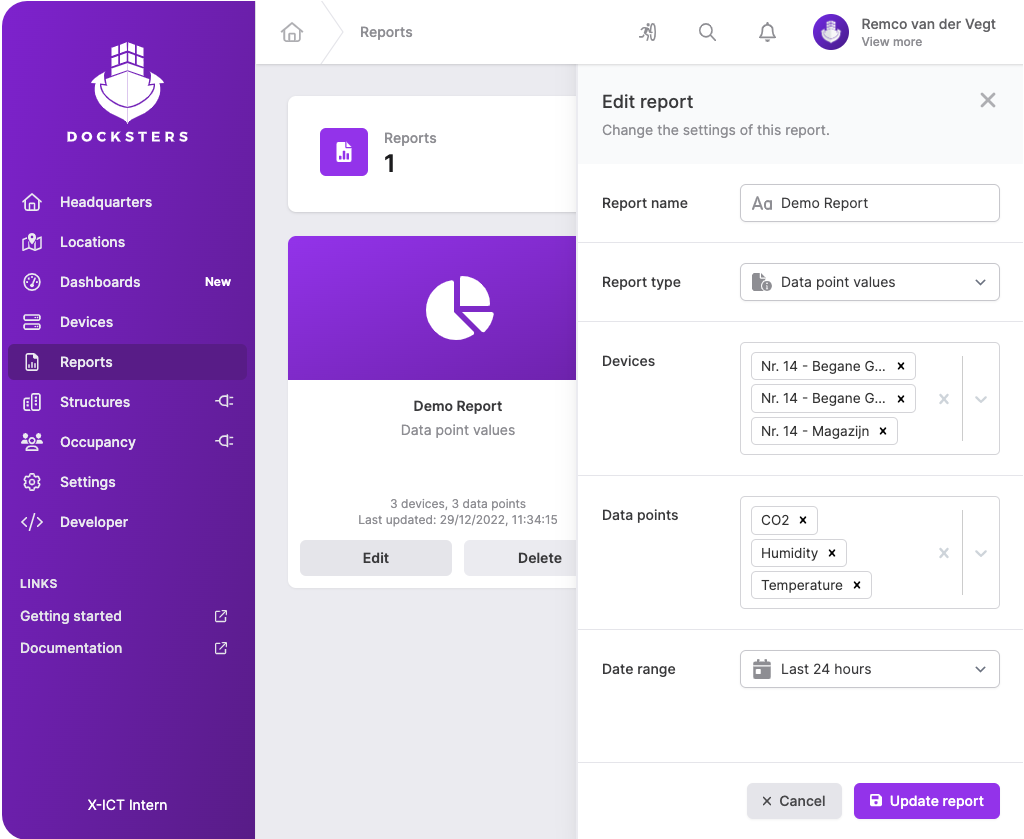
Report settings
Reports are easily customisable. You decide what you want to see in your reports. We currently have two report times; data point values and gps locations. To add a new report, click on the empty report shape. To edit an existing report, press the edit button below the report.
When adding/editing a report, you have a few options. First off, you need to select one of the two report types. Next up, you need to select the devices and data points that you want to display in your report. Lastly, you need to enter a date range for your report.
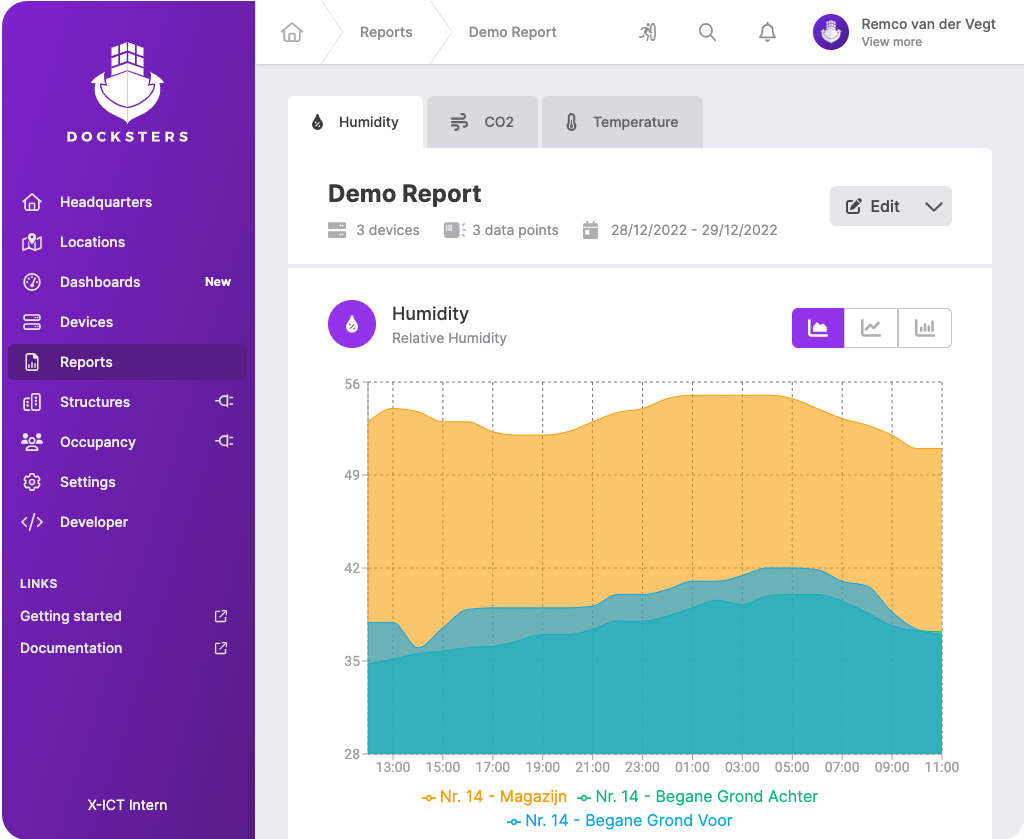
View report
To view your report, simply click on the report in the list. Within a few seconds, you will be presented with your own custom report! To change the view of your report, to download the report in PDF format, or to download the data in your report in CSV format, click on the dropdown button next to the edit button. If you have any questions about the Reports module or this tutorial, please contact us.